
PICTURE: Nakamba's Heat Map Versus Burnley Revealed
4 years agoThu, 03 Oct 2019 23:07:05 GMT

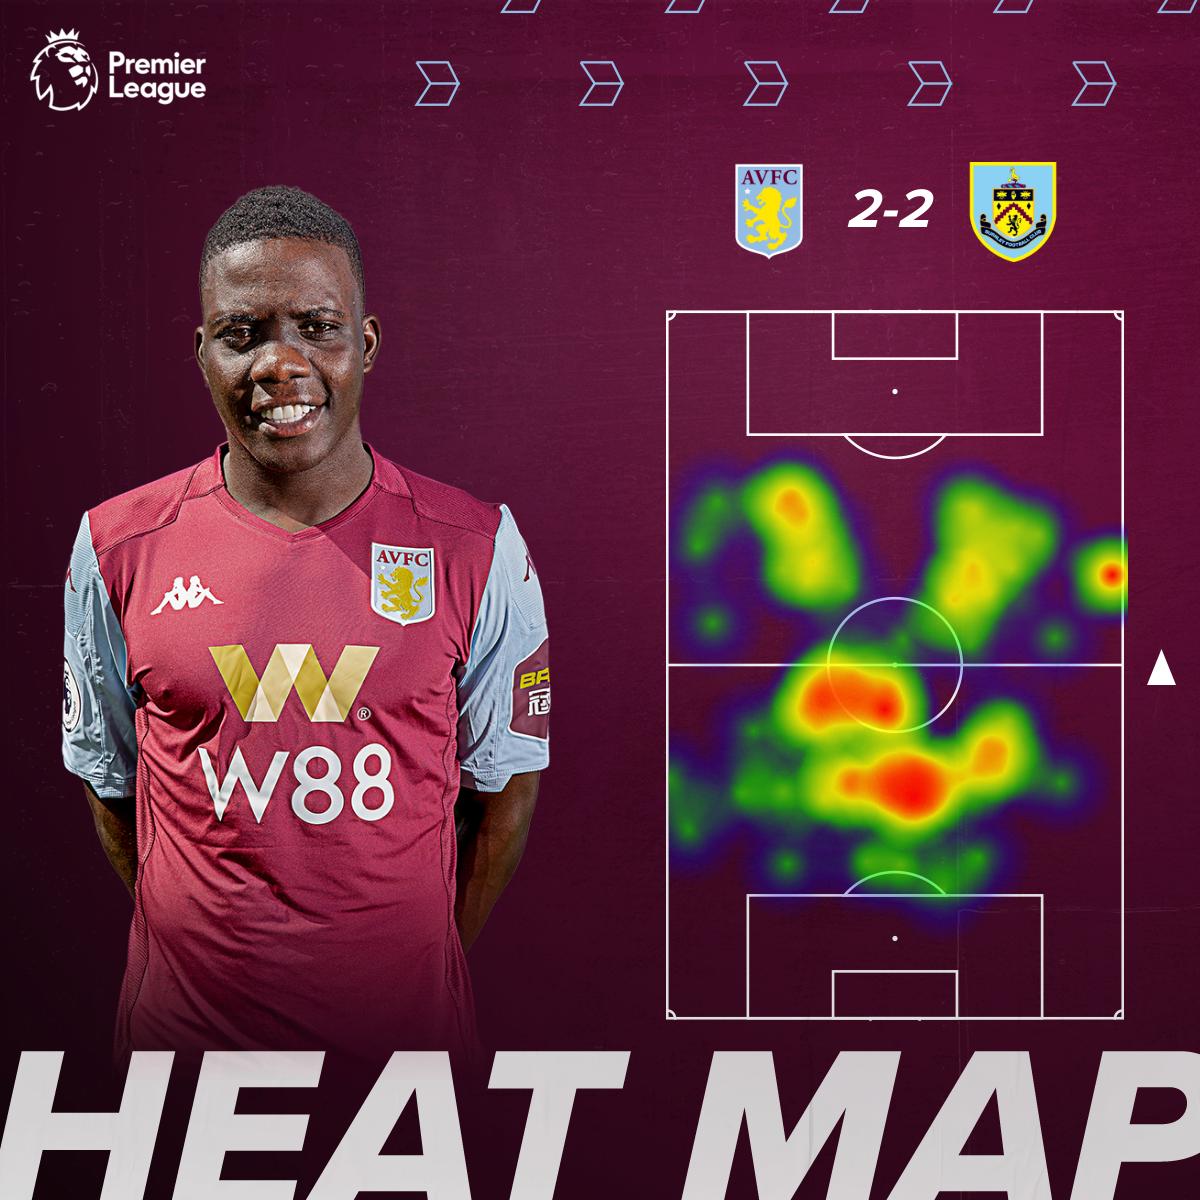
Aston Villa has released midfielder Marvelous Nakamba‘s heat map in the 2-2 draw against Burnley and hailed his incredible energy levels.
According to quora.com, heat maps in football or any other Sport are used to identify the frequency of events spread in a given particular area.
Put simply, they show a player’s movements during a match and areas of the pitch that he frequented or covered during the course of the game.
Pindula is best experienced in the Android App
Download here ⬇️:
play.google.com/store/apps/details?id=co.zw.pindula.news


